Privacy Preserving Queries: Surveying Populations Without Revealing Individuals' Identities
Imagine that you were asked to discover whether the workplace is generally happy. Unfortunately, your organization happens to be run by a semi-evil dictator who would fire anyone he knows for sure is unhappy:

Normally you might use a standard survey, but you cannot in good conscience ask individuals to fill out a survey that may get them fired. What can you do?
Enter Differential Privacy. The key is to give an individual plausible deniability in their specific response, but collectively provide a relevant statistic. With randomness at our side, we can have a surprisingly simple survey approach that will let us know approximately if most people are happy or unhappy.
Randomized Response Function
Our survey where we whether an employee is happy or unhappy can be generalized to a binary function that asks whether an employee is happy, returning True when happy or False when unhappy.
With this generalization in mind we can write an algorithm that can guarantee privacy at an individual level with any binary response query. This same approach will work regardless if you are asking an individual a survey question, sending anonymized user event statistics over the internet, or peeking into a test set without overfitting (to be covered in more detail later).
The privacy preserving function that we will use is called the “randomized response function”, where individually we can return either True or False regardless of what our true response value is. The algorithm is quite simple:
- Randomly pick
TrueorFalse - If you picked
True, return the true response - Else return a new random
TrueorFalse
Super simple! If we break down every possible combination of values, we can see that while there is uncertainty about an individual’s response, when many individuals are combined together we begin to see a sketch of the true number of True and False values:
| True Response | First Random Value | Second Random Value | Output |
|---|---|---|---|
| True | True | True | True |
| True | True | False | True |
| True | False | True | True |
| True | False | False | False |
| False | True | True | False |
| False | True | False | False |
| False | False | True | True |
| False | False | False | False |
From this table we see when True Response = True, \(p(True \vert True) = 3/4\). When True Response = False, \(p(True \vert False) = 1/4\).
If we ask an individual what their true response is and they say True, we expect \(3/4\) of the time that their true response is True. So if you start firing people who say False, you will incorrectly fire \(1/4\) of your workplace - enough that even our semi-evil dictator takes pause.
In our example, our dictator is only semi-evil. A fully evil dictator simply does not care about a false positive rate of \(1/4\) and will still fire anyone who tells him they are unhappy, knowing some happy employees will be fired as well. What this approach guarantees is that even if most unhappy employees will be fired (\(3/4\) on average) there will still be some unhappy employees left around. Our evil dictator will never be completely successful picking out individuals, and even if they fired \(1/4\) of the workplace we will still be able to estimate workplace happiness. That’s pretty cool!
Population Happiness
The next step is to use our individually randomized survey and determine if these individuals are happy overall. The expected number of happy responses is:
\[E[\#True] = \#True * p(True \vert True) + \#False * p(True \vert False)\] \[E[\#True] = \#True * 3/4 + \#False * 1/4\]Individuals are happy overall when the number of happy responses is greater than the number of unhappy responses. Put symbolically this is true if \(\#True > \#False\). This will begin to happen when \(\#True \approx \#False\), and continue until \(\#Surveys = \#True\). When \(\#True = \#False\) we expect \(E[\#True] = \#Surveys / 2\). Therefore a simple approximate test to see if employees are generally happy is when \(\#True > \#Surveys/2\).
Putting it All Together
For this algorithm, the number of times our happiness threshold \(\#True > \#Surveys/2\) fails to indicate the correct response is captured in the CDF of a Binomial Distribution. If you want to model how randomized response will perform with your population, plot the CDF of the Binomial distribution for \(n=\#employees\) and \(p=0.5\).
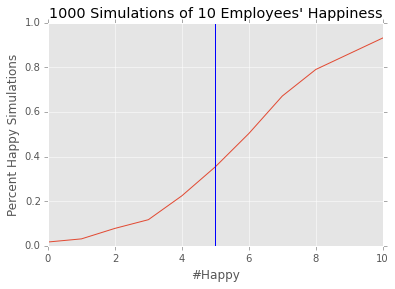
In practice, it’s always good to test randomized methods with simulation. This algorithm works great as the number of employees grows. If we only have 10 employees, expect a lot of noise:
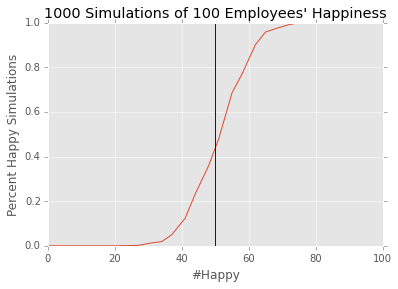
However if you have 100, we have a much better algorithm:
While analysis with this approach are not exact, one should be able to feel comfortable saying that employees are fairly happy when the threshold is passed. One can make the threshold more strict by adding an offset, such as one standard deviation \(\#True > \#Surveys/2 + \sqrt{\#Surveys}/2\):
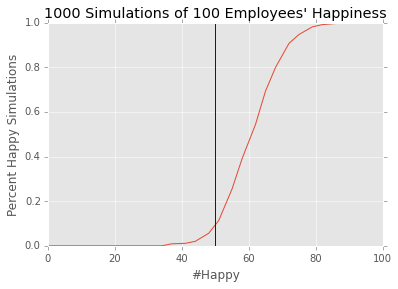
This significantly reduces the false positive rate but at the cost of false negatives.
I’ve put the implementation of this up on github in an ipython notebook, hopefully others find it helpful!
Cautionary Notes
This approach in itself doesn’t fully prevent information leakage when there are multiple queries asked to the same employee, either by asking the same query multiple times or asking multiple queries that are related.
If a spy attempts to ask an employee the same question twice or more, the employee will inadvertently leak more information about their true response value. A simple solution to this is to only ever answer a question once as an employee, or alternatively return random values after the first response.
The spy realizes they cant ask the same question twice, so instead they ask multiple related questions much like the 20-questions game. For example, if you wanted to determine a user’s age, you could ask multiple questions like \(age < 40\), \(age < 30\), \(age < 20\). Although these are all binary questions, they are not independent and will probabilistically leak some information about the age of a user (ex: if \(age < 20\) then \(age < 30\) and \(age < 40\)). With dependent queries the privacy guarantees will fail without modifications to incorporate additional noise. However, privacy is still preserved if the questions are independent.
Less realistically, there are also timing attacks that one could make that reveal when a user is returning their true response. With the simple implementation of the randomized response function there will be different cycle counts and memory accesses arising from the naive implementation using a branch and drawing the random numbers lazily; it takes longer to draw two random numbers than one. It’s very unlikely this difference will be measurable with a fast random number generator; however, one could easily make a branchless version not susceptible to timing attacks.
Learn More
If you want to learn more about differential privacy, I highly recommend reading “The Algorithmic Foundations of Differential Privacy” by Cynthia Dwork and Aaron Roth. It covers both practical examples and theory behind common techniques.
I will review some of the recent results using differential privacy within data analysis and machine learning in an upcoming post to be linked here in the future.